Inflation Statistics
- 2019 the CPI was 251.712, with a monthly inflation rate of 0.2%
- 2019 yearly inflation rate was 1.6%
- Overall rise of core inflation over the past 3-years is close to 2.2%.
- Inflation is predicted to rise to 2.4% by 2024
- In 2019 the food index rose 2.1%
- Money has lost about 65% of its purchasing power since 1980
- Inflation encourages spending – consumers typically will try to purchase as much as possible before the price increases from inflation
- During some of the years between 2010-2024, the US economy did experienced a decline with inflation rates
Inflation Statistics 2019-2020
Inflation is a dirty word that the average consumer just does not want to hear. This term represents an increase in consumer spending. This term also means that it is becoming more expensive to live. The following statistics will be used to explain the current state of inflation during the year 2019 and how it impacts people lives today.
The Consumer Price Index Calculator 2019
 The Consumer Price Index (CPI) calculator is one of the most accurate tools for measuring inflation. The Bureau of Labor Statistics uses this tool every month to figure out the current state of inflation. The CPI measures the increase or decrease in the price of goods and services. The measurements are taken in key categories that impact consumer spending the most.
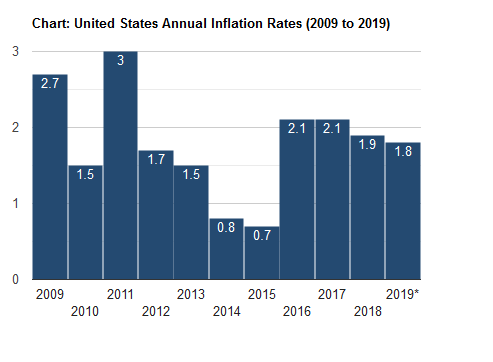
The CPI calculator takes a reading for each month of the year. In January of 2019 the CPI was 251.712 and the monthly inflation rate was 0.2%. The yearly inflation rate at this time was 1.6%. These figures simply increased until December of 2019. What these figures proves is that inflation steadily climbs or increases over time.
Keep in mind that throughout a given year, inflation can (and often does) decrease. However, that does not mean that inflation will start to decline over the long run. Remember, the costs associated with providing goods and services to the market are constantly increasing for most businesses. As a result, people have to pay more for products and services. The CPI calculator provides a useful month by month view of how inflation impacts consumer purchasing power.
The Breakdown of Inflation from 2016 to 2019
The Balance is an online economic site that provides financial information for various sectors of society. This online publication featured an article about inflation rates that covered the years 2007 to 2019. In their statistics they highlighted every month within a given year between 2016 to 2019. During each month, they focused on key changes to the CPI factor that influenced the rise and fall of inflation.
The overall rise of core inflation over this 3-year span was close to 2.2%. When this figure gets over 2.0% the Federal Reserve then decides to lower the Federal Fund Rate for interest. Now, this does not always happen but it usually takes place to help keep the economy balanced and the consumer dollar from declining too much. By the way, core inflation measures the change in the cost of goods and services outside of the energy and food sectors within society.
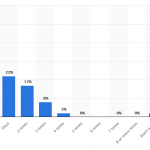
Projected Inflation from 2010 to 2024
When economists evaluate inflation rates, they tend to look at this data over an extended period. This is important for getting a clear picture about the impact of inflation on the American dollar. Remember, consumers are trying to constantly keep their dollar strong and intact. They want more spending power. However, inflation erodes this process due to the constant price fluctuation of goods and services.
Statista.com is a statistics site that evaluates various criteria for various industries and fields. They provided information about inflation statistics from 2010 to 2024. These statistics showed how inflation gradually increased through the years. It also predicted that inflation will rise to 2.4% by 2024.
Don’t forget that some of the years between 2010 and 2024, the economy experienced a decline with inflation rates. Still, overall core rates are expected to rise by the mid 2020’s. This information helps the government, industries, businesses and financially minded consumers to plan how to properly use their financial resources now and well into the future.
The Tricky Part of Evaluating Inflation Statistics for the U.S. Economy
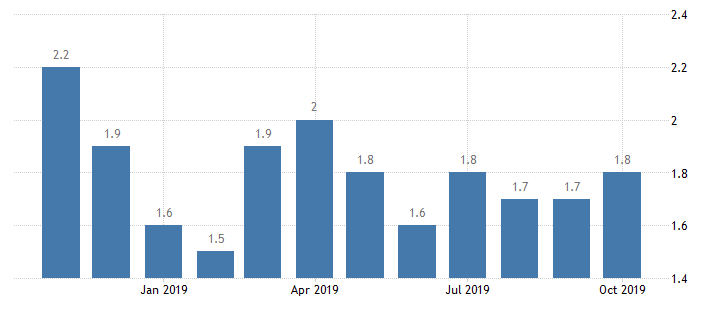
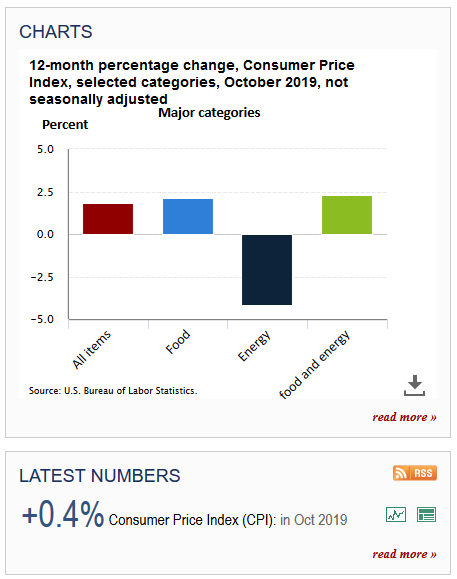
Tracking inflation can be a misleading and tricky process. We already stated that food and energy are tracked differently from other consumer goods and services. These differences sometimes make it hard to figure out how the dollar is doing within economy.For example, a family could experience a decline in fuel prices over a 6-month period but have to pay for an increase in food prices within the same amount of time.
Trading Economics explains that in 2019 the food index rose 2.1% by October of that year. They used an annual figure that started in October of 2018 to show the rising cost of food until 2019. Within the same time frame, the price of fuel had declined. People were paying less for transportation cost. Again, this shows how tricky inflation can be for consumers.
The point is that some sections of the economy will allow consumers to save money.
However, other sections of the economy will gradually increase with expenses. This will help to keep the overall inflation levels on the rise. Ultimately, consumers have to understand that they are going to pay more for certain services and products even if they are paying less money for others.
How Inflation Encourages Spending and Investing within the Economy
Many people wish they could get their products and services for free. However, this is only wishful thinking because everything has a price. Inflation encourages spending. Why does this factor encourage people to spend? It has to do with getting more stuff for their money.
For example, if a candy bar costs $1.00 today but is expected to rise to $1.50 within the next year; consumers who like candy (and are aware of inflation) will try to purchase as much candy as possible before the price increases. This is an oversimplified example about how inflation encourages spending. However, it does provide a general idea about how people are spending money within our economy.
Investopedia explains that if a person had kept $29 from 1980 and tried to spend it today, their money would lose at least 65% of its purchasing power. Once again, consumers know their dollars are losing value over time. This is why they have a tendency to buy things now, instead of later.
Inflation Statistics in Response to Employee Income
All workers are impacted by inflation. According to the Inflation Data website, a worker making $10 an hour today would start to lose their purchasing power if their income doesn’t change. In other words, if a person makes $10 an hour, and inflation increases 5% a year; then that employee would lose purchasing power and eventually will have to struggle to earn a living.
This is one reason why employers have to constantly adjust employee wages to cover the rising costs of an employee’s living expenses. Employers typically provide a wage increase for their employees that is slightly lower than the current inflation increase. This way, they can help to cover employee living expenses without losing money from their company. Ultimately, everyone must adjust their spending, operational and living expenses for inflation.